Read before use
1, check data with precheck (windows version) tools
2, data from excel, copy and paste data into the input frame
3, data from txt, must tab-seperated, copy and paste data into the input frame
4, specieal and non-English characters such as #, <, >, %, (, ), α are not friendly
5, use point as decimal separator, not comma. e.g. 3.14, not 3,14 as pi
Required
circRNA data (name, 1, length)

miRNA binding data (name, start, end)
note: miRNA binding location MUST NOT overlap

Optional
miRNA fontsize:
circRNA fontsize:
distance of miRNA name to center:

Colors
circRNA color:
miRNA color:

Fontfamily


circRNA-miRNA interaction plot

Introduction
cirRNAs function as miRNA sponge, and plot by coordinates. circRNA: outer, miRNA: inner. The coordinate can be calculated by miRanda
Input data instructions
circRNA data contain 3 columns: circRNA, start (1 by default), and stop (length of circRNA).
miRNA data contains 3 columns: miRNA, start, end. miRNA coordinates must not be overlap.
Paper example
Bioinformatics analysis of potential glioblastoma circular RNA sponge network
Writing tips
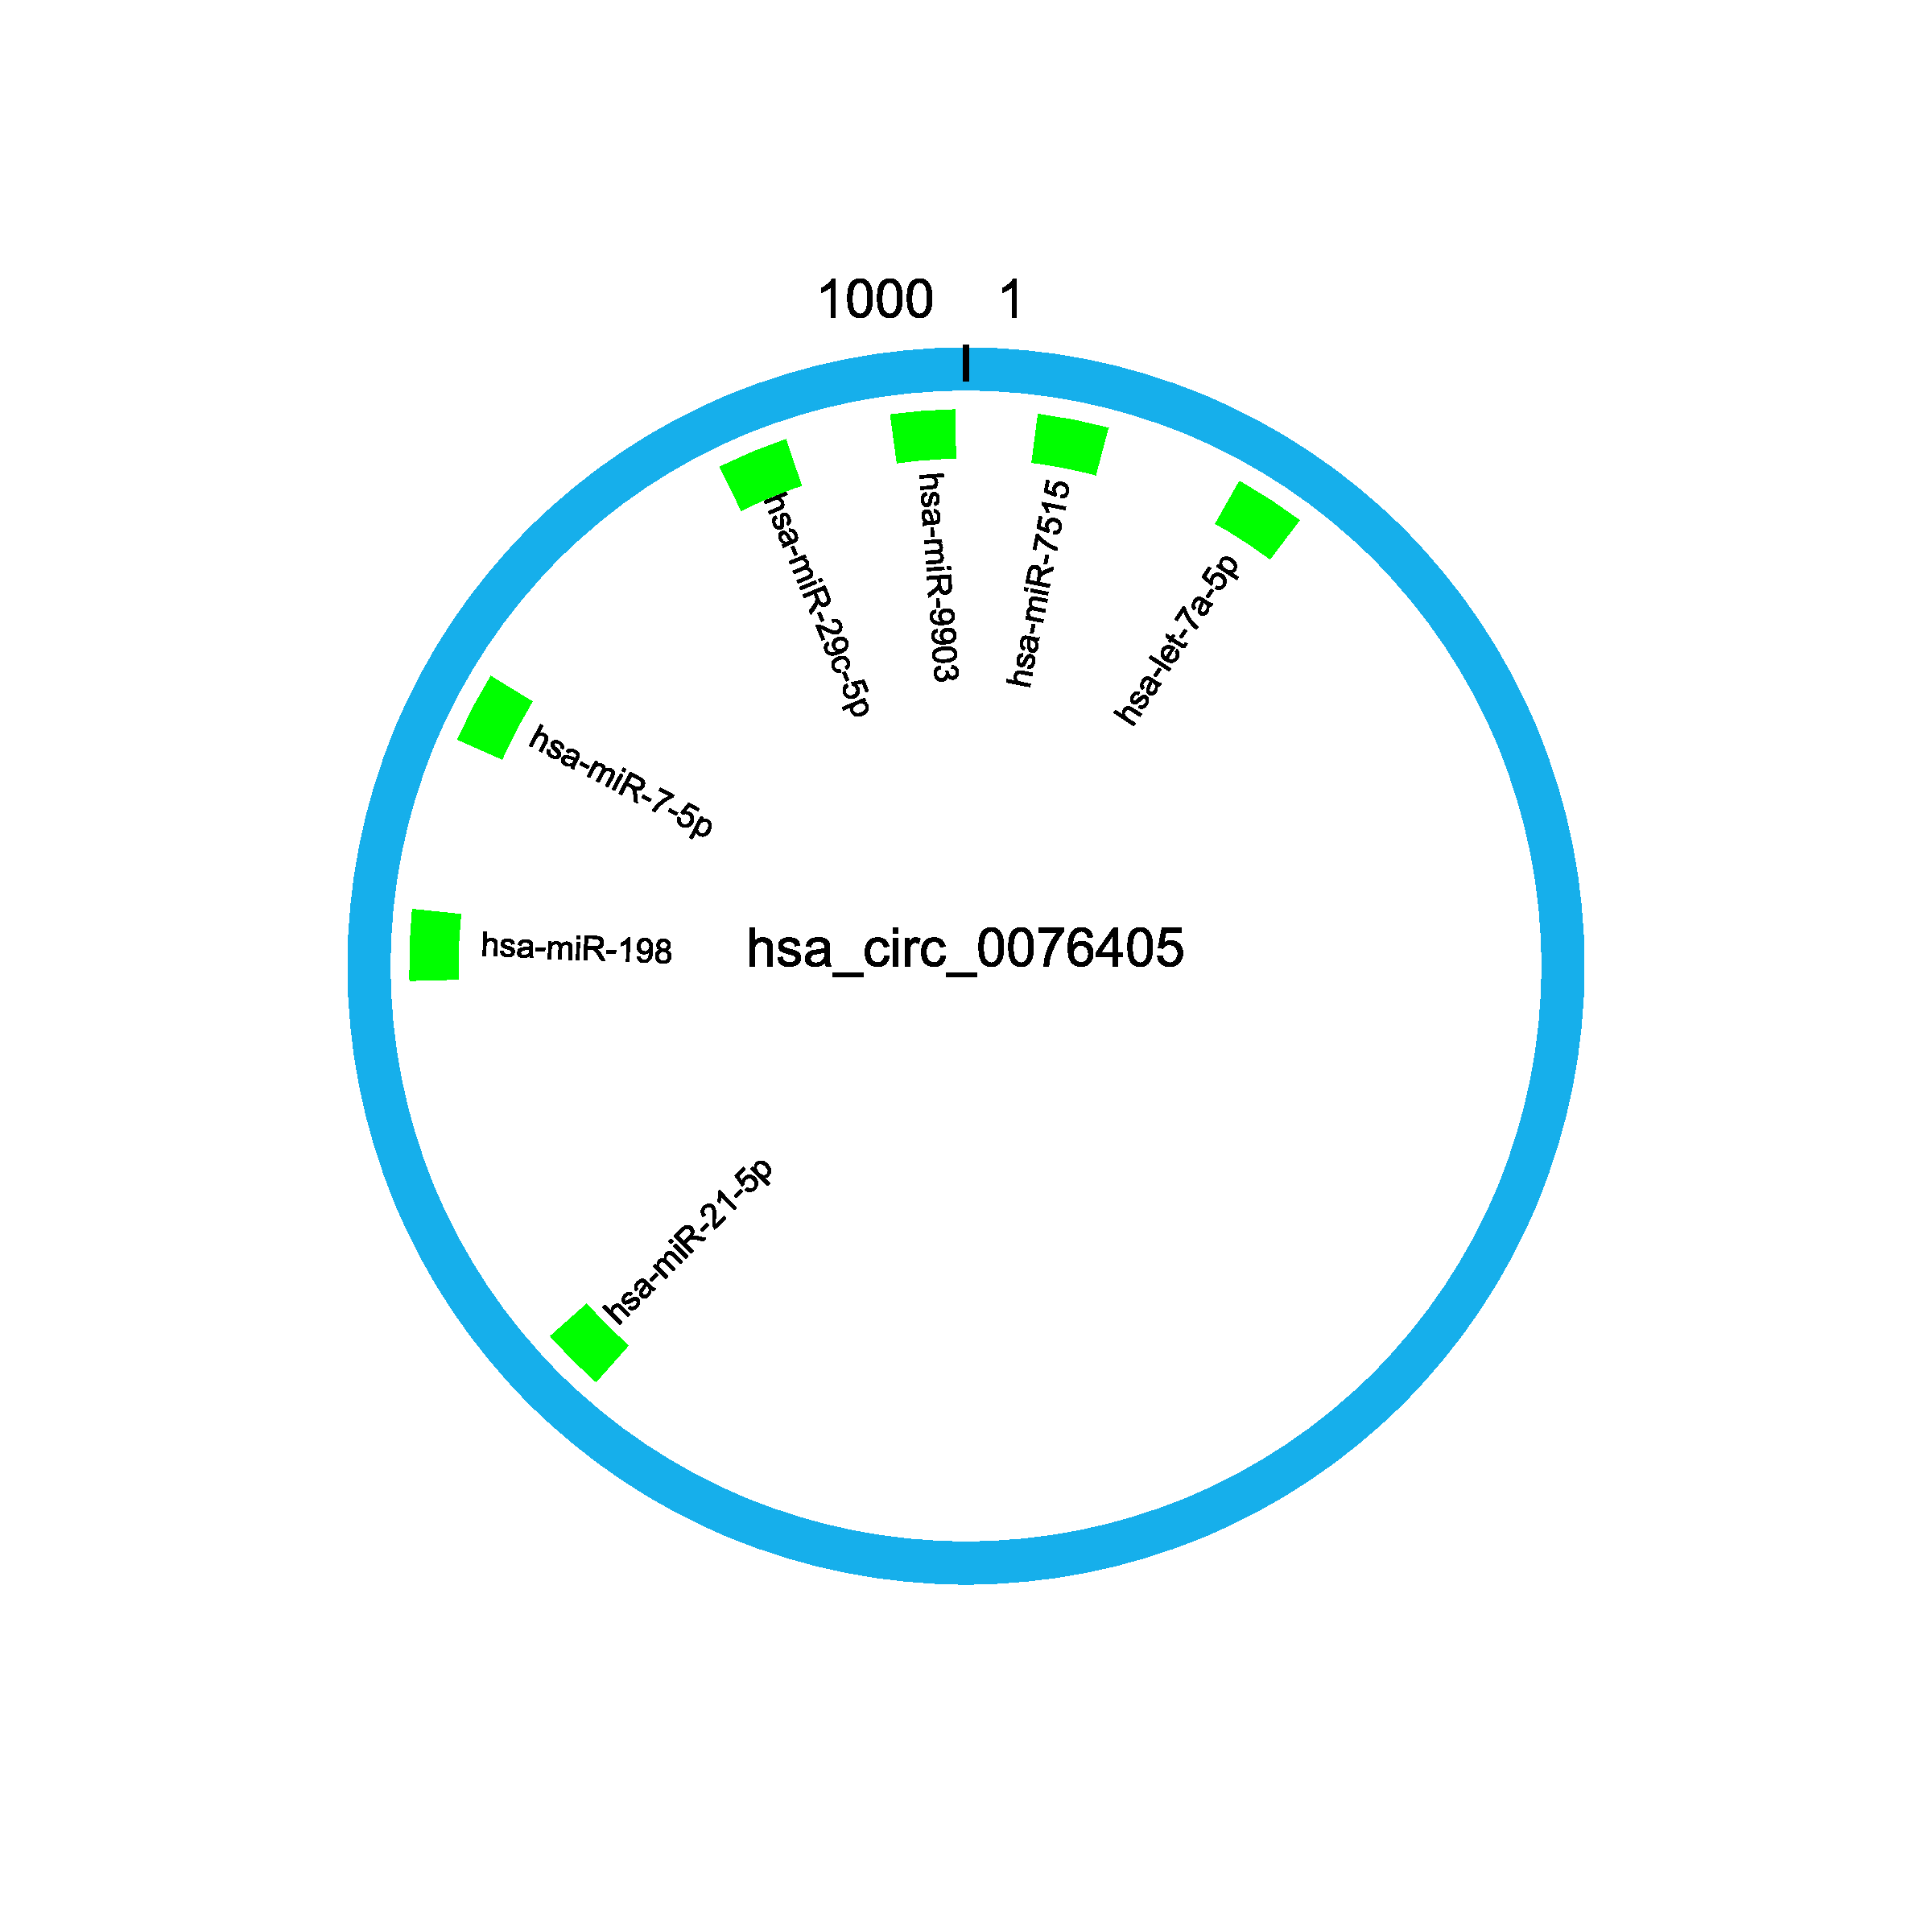
Binding simulation between circRNA and miRNAs. circRNA was represented by outer green circle, and miRNAs were represented by inner red rectangle. The relative locations of miRNAs to circRNA represented the binding sites.
circRNA input
hsa_circ_0076405	1	1000
miRNA input
hsa-miR-7515	20	40
hsa-let-7a-5p	80	100
hsa-miR-21-5p	620	638
hsa-miR-198	750	770
hsa-miR-7-5p	820	840
hsa-miR-29c-5p	930	950
hsa-miR-9903	980	998
Output

1) How to plot?
1, Put data in excel according to the example format.
2, Copy and paste into input frame.
3, Input pre-checking button to check input
4, After checking pass, select parameters, submit and download

2) How to cite?
4000+ papers in (Google Scholar)
Tang D, Chen M, Huang X, Zhang G, Zeng L, Zhang G, Wu S, Wang Y. SRplot: A free online platform for data visualization and graphing. PLoS One. 2023 Nov 9;18(11):e0294236. doi: 10.1371/journal.pone.0294236. PMID: 37943830.

3) FAQs