miRNA-mRNA, miRNA-circRNA, miRNA-lncRNA interaction prediction by miRanda
Introduction
miRanda is an algorithm for the detection of potential microRNA target sites in genomic sequences. miRanda is an algorithm for the detection of potential microRNA target sites in genomic sequences. miRanda reads RNA sequences
(such as microRNAs) from file1 and genomic DNA/RNA sequences from file2. One or more miRNA sequences from file1 are scanned against all sequences in file2 and potential target sites are reported. Potential
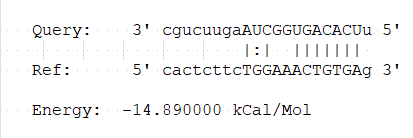
target sites are identified using a two-step strategy. First a dynamic programming local alignment is carried out between the query
miRNA sequence and the reference sequence. This alignment procedure scores based on sequence complementarity and not on
sequence identity. In other words we look for A:U and G:C matches instead of A:A, G:G, etc. The G:U wobble bair is also permitted, but
generally scores less than the more optimal matches. One or more miRNA sequences from file1 are scanned against all sequences in file2 and potential target sites are reported. Potential
target sites are identified using a two-step strategy. First a dynamic programming local alignment is carried out between the query
miRNA sequence and the reference sequence. This alignment procedure scores based on sequence complementarity and not on
sequence identity. In other words we look for A:U and G:C matches instead of A:A, G:G, etc. The G:U wobble bair is also permitted, but
generally scores less than the more optimal matches. Find source code in official website.
Input data instructions
1, miRNA sequence in fasta format.
2, target sequence (mRNA 3'UTR, lncRNA, circRNA) in fasta format.
In the output file, '|' means perfect match, ':' means G:U pair, ' ' means mismatch.
Reference
A.J. Enright, B. John, U. Gaul, T. Tuschl, C. Sander, D.S. Marks; (2003) MicroRNA targets in Drosophila; Genome Biology 5(1):R1.
| miRNA sequence |
>hsa-miR-27b
UUCACAGUGGCUAAGUUCUGC |
| Target sequence |
>Bcl3
GACGGATGGGGGGGCAGACCCGGACTCATGAGGAGGGGCCTCCCTGCCCTGT
GGGGACCACTCTTCTGGAAACTGTGAGGACCTTGTTCTGCTTCCCCCCGCCC
AATCCTCGGGACCAGGTTTTGCACCAAGGCACATGCACATACTACTGAGCACA
GATCCTCCCAATCGCGCCCCTTGCCCAGGACTCTCAGCCCCCACTTAATCTCA
GGCACCCAGGTTCCCTGTCTGGAATCCACCAGATACTCAATTCTTTGAGTGGA
GGAACCAAAGGACAGCCAGCCTCTCCTCTGCCACCCTCCACCCTGAGGGACCC
AGAGAAACAGAGGGGTCTGGGAGGGCATTGATCACAGTGTAAATTATTAGGTT
TGGGTCAGATTTCTTTTGTAATAAACTATTTTTGTATCAT |
| Output |

|
1) How to plot?
1, Put data in excel according to the example format.
2, Copy and paste into input frame.
3, Input pre-checking button to check input
4, After checking pass, select parameters, submit and download
2) How to cite?
4000+ papers in (Google Scholar)
Tang D, Chen M, Huang X, Zhang G, Zeng L, Zhang G, Wu S, Wang Y. SRplot: A free online platform for data visualization and graphing. PLoS One. 2023 Nov 9;18(11):e0294236. doi: 10.1371/journal.pone.0294236. PMID: 37943830.
3) FAQs
