Read before use
1, check data with precheck (windows version) tools
2, data from excel, copy and paste data into the input frame
3, data from txt, must tab-seperated, copy and paste data into the input frame
4, specieal and non-English characters such as #, <, >, %, (, ), α are not friendly
5, use point as decimal separator, not comma. e.g. 3.14, not 3,14 as pi
Note: This module consumes server resources heavily.
Required
peak1 name:
peak1 data:

Optional
peak2 name:
peak2 data:

peak3 name:
peak3 data:

peak4 name:
peak4 data:

peak5 name:
peak5 data:

peak6 name:
peak6 data:


Figure size
figure width:
figure height:

Species and genome build
human (hg38, Ensembl v108)
human (hg19, Ensembl v87)
mouse (mm39, Ensembl v108)
rat (rn6, Ensembl v104)

Head and tail (1000 bp by default)
yes no

Type of RNA
mRNA ncRNA transcript
fontfamily


This figure will take ~6 min, do not refresh pages

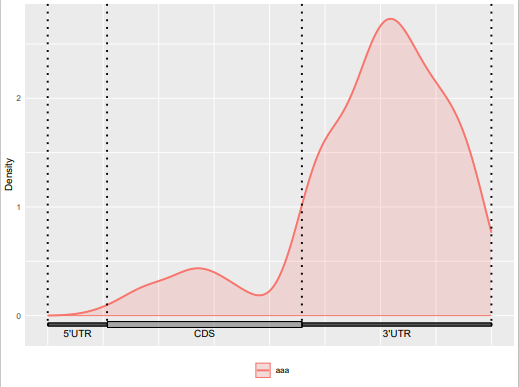
MeRIP-seq peak MetaPlot

Introduction
At most 6 peak files. For more, please contact us.
Data instructions
Data contains strand by default. 6 columns: chrom start end name value strand. If no strand information, using forward strand (+)
Examples in paper
Dynamic m6A mRNA methylation reveals the role of METTL3-m6A-CDCP1 signaling axis in chemical carcinogenesis Fig 1A.
Input Example data
Output

1) How to plot?
1, Put data in excel according to the example format.
2, Copy and paste into input frame.
3, Input pre-checking button to check input
4, After checking pass, select parameters, submit and download

2) How to cite?
4000+ papers in (Google Scholar)
Tang D, Chen M, Huang X, Zhang G, Zeng L, Zhang G, Wu S, Wang Y. SRplot: A free online platform for data visualization and graphing. PLoS One. 2023 Nov 9;18(11):e0294236. doi: 10.1371/journal.pone.0294236. PMID: 37943830.

3) FAQs