test account: test Password: bio123456
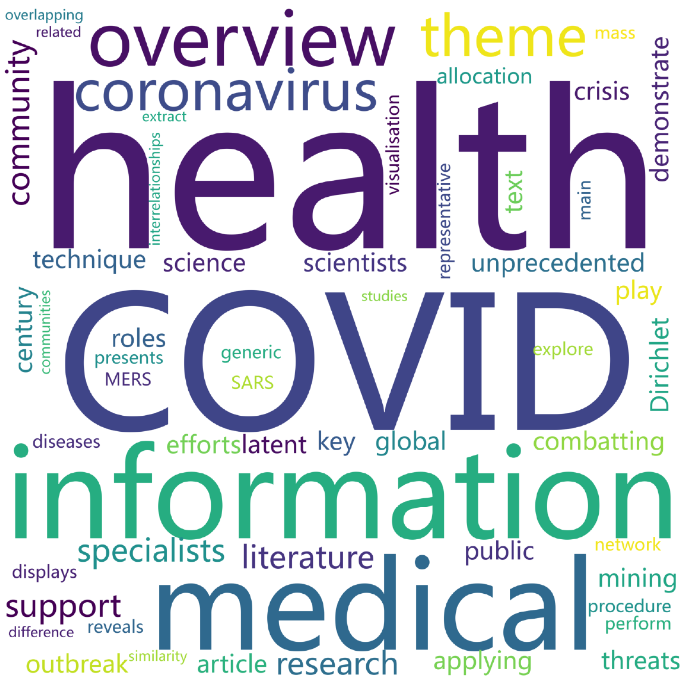
| Input | The unprecedented outbreak of COVID-19 is one of the most serious global threats to public health in this century. During this crisis, specialists in information science could play key roles to support the efforts of scientists in the health and medical community for combatting COVID-19. In this article, we demonstrate that information specialists can support health and medical community by applying text mining technique with latent Dirichlet allocation procedure to perform an overview of a mass of coronavirus literature. This overview presents the generic research themes of the coronavirus diseases: COVID-19, MERS and SARS, reveals the representative literature per main research theme and displays a network visualisation to explore the overlapping, similarity and difference among these themes. The overview can help the health and medical communities to extract useful information and interrelationships from coronavirus-related studies. |
| Output |

|
1) How to plot?
1, Put data in excel according to the example format.
2, Copy and paste into input frame.
3, Input pre-checking button to check input
4, After checking pass, select parameters, submit and download
2) How to cite?
4000+ papers in (Google Scholar)
Tang D, Chen M, Huang X, Zhang G, Zeng L, Zhang G, Wu S, Wang Y. SRplot: A free online platform for data visualization and graphing. PLoS One. 2023 Nov 9;18(11):e0294236. doi: 10.1371/journal.pone.0294236. PMID: 37943830.
3) FAQs