Voronoi treemaps
Introduction
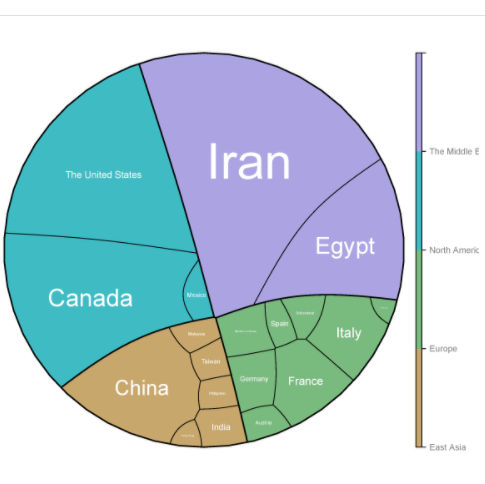
Voronoi treemaps visualise hierarchical data by recursively partitioning convex polygons using weighted centroidal Voronoi diagrams. The polygon areas are proportional to the relative weights of their corresponding nodes. The animation above shows the algorithm running one iteration at a time for each node of the tree.
Input data instructions
Input data contains 3 columns: the first column is continent/sub-continent, the second column is country/district, and the third column is number of COVID-19 patients.
Note: can accept more column data.
Paper example
Tracking the origin of early COVID-19 cases in Canada Fig 1.
1) How to plot?
1, Put data in excel according to the example format.
2, Copy and paste into input frame.
3, Input pre-checking button to check input
4, After checking pass, select parameters, submit and download
2) How to cite?
4000+ papers in (Google Scholar)
Tang D, Chen M, Huang X, Zhang G, Zeng L, Zhang G, Wu S, Wang Y. SRplot: A free online platform for data visualization and graphing. PLoS One. 2023 Nov 9;18(11):e0294236. doi: 10.1371/journal.pone.0294236. PMID: 37943830.
3) FAQs