Read before use
1, check data with precheck (windows version) tools
2, data from excel, copy and paste data into the input frame
3, data from txt, must tab-seperated, copy and paste data into the input frame
4, specieal and non-English characters such as #, <, >, %, (, ), α are not friendly
5, use point as decimal separator, not comma. e.g. 3.14, not 3,14 as pi
Required

Optional
Figure size
figure width:
figure height:

Fontsize
ticks fontsize:
axis label fontsize:
legend fontsize:

Labels
X label:
Y label:

Colors (10+ system default colors)
color 1:
color 2:
color 3:
color 4:
color 5:
color 6:
color 7:
color 8:
color 9:
color 10:

Grid


Fontfamily


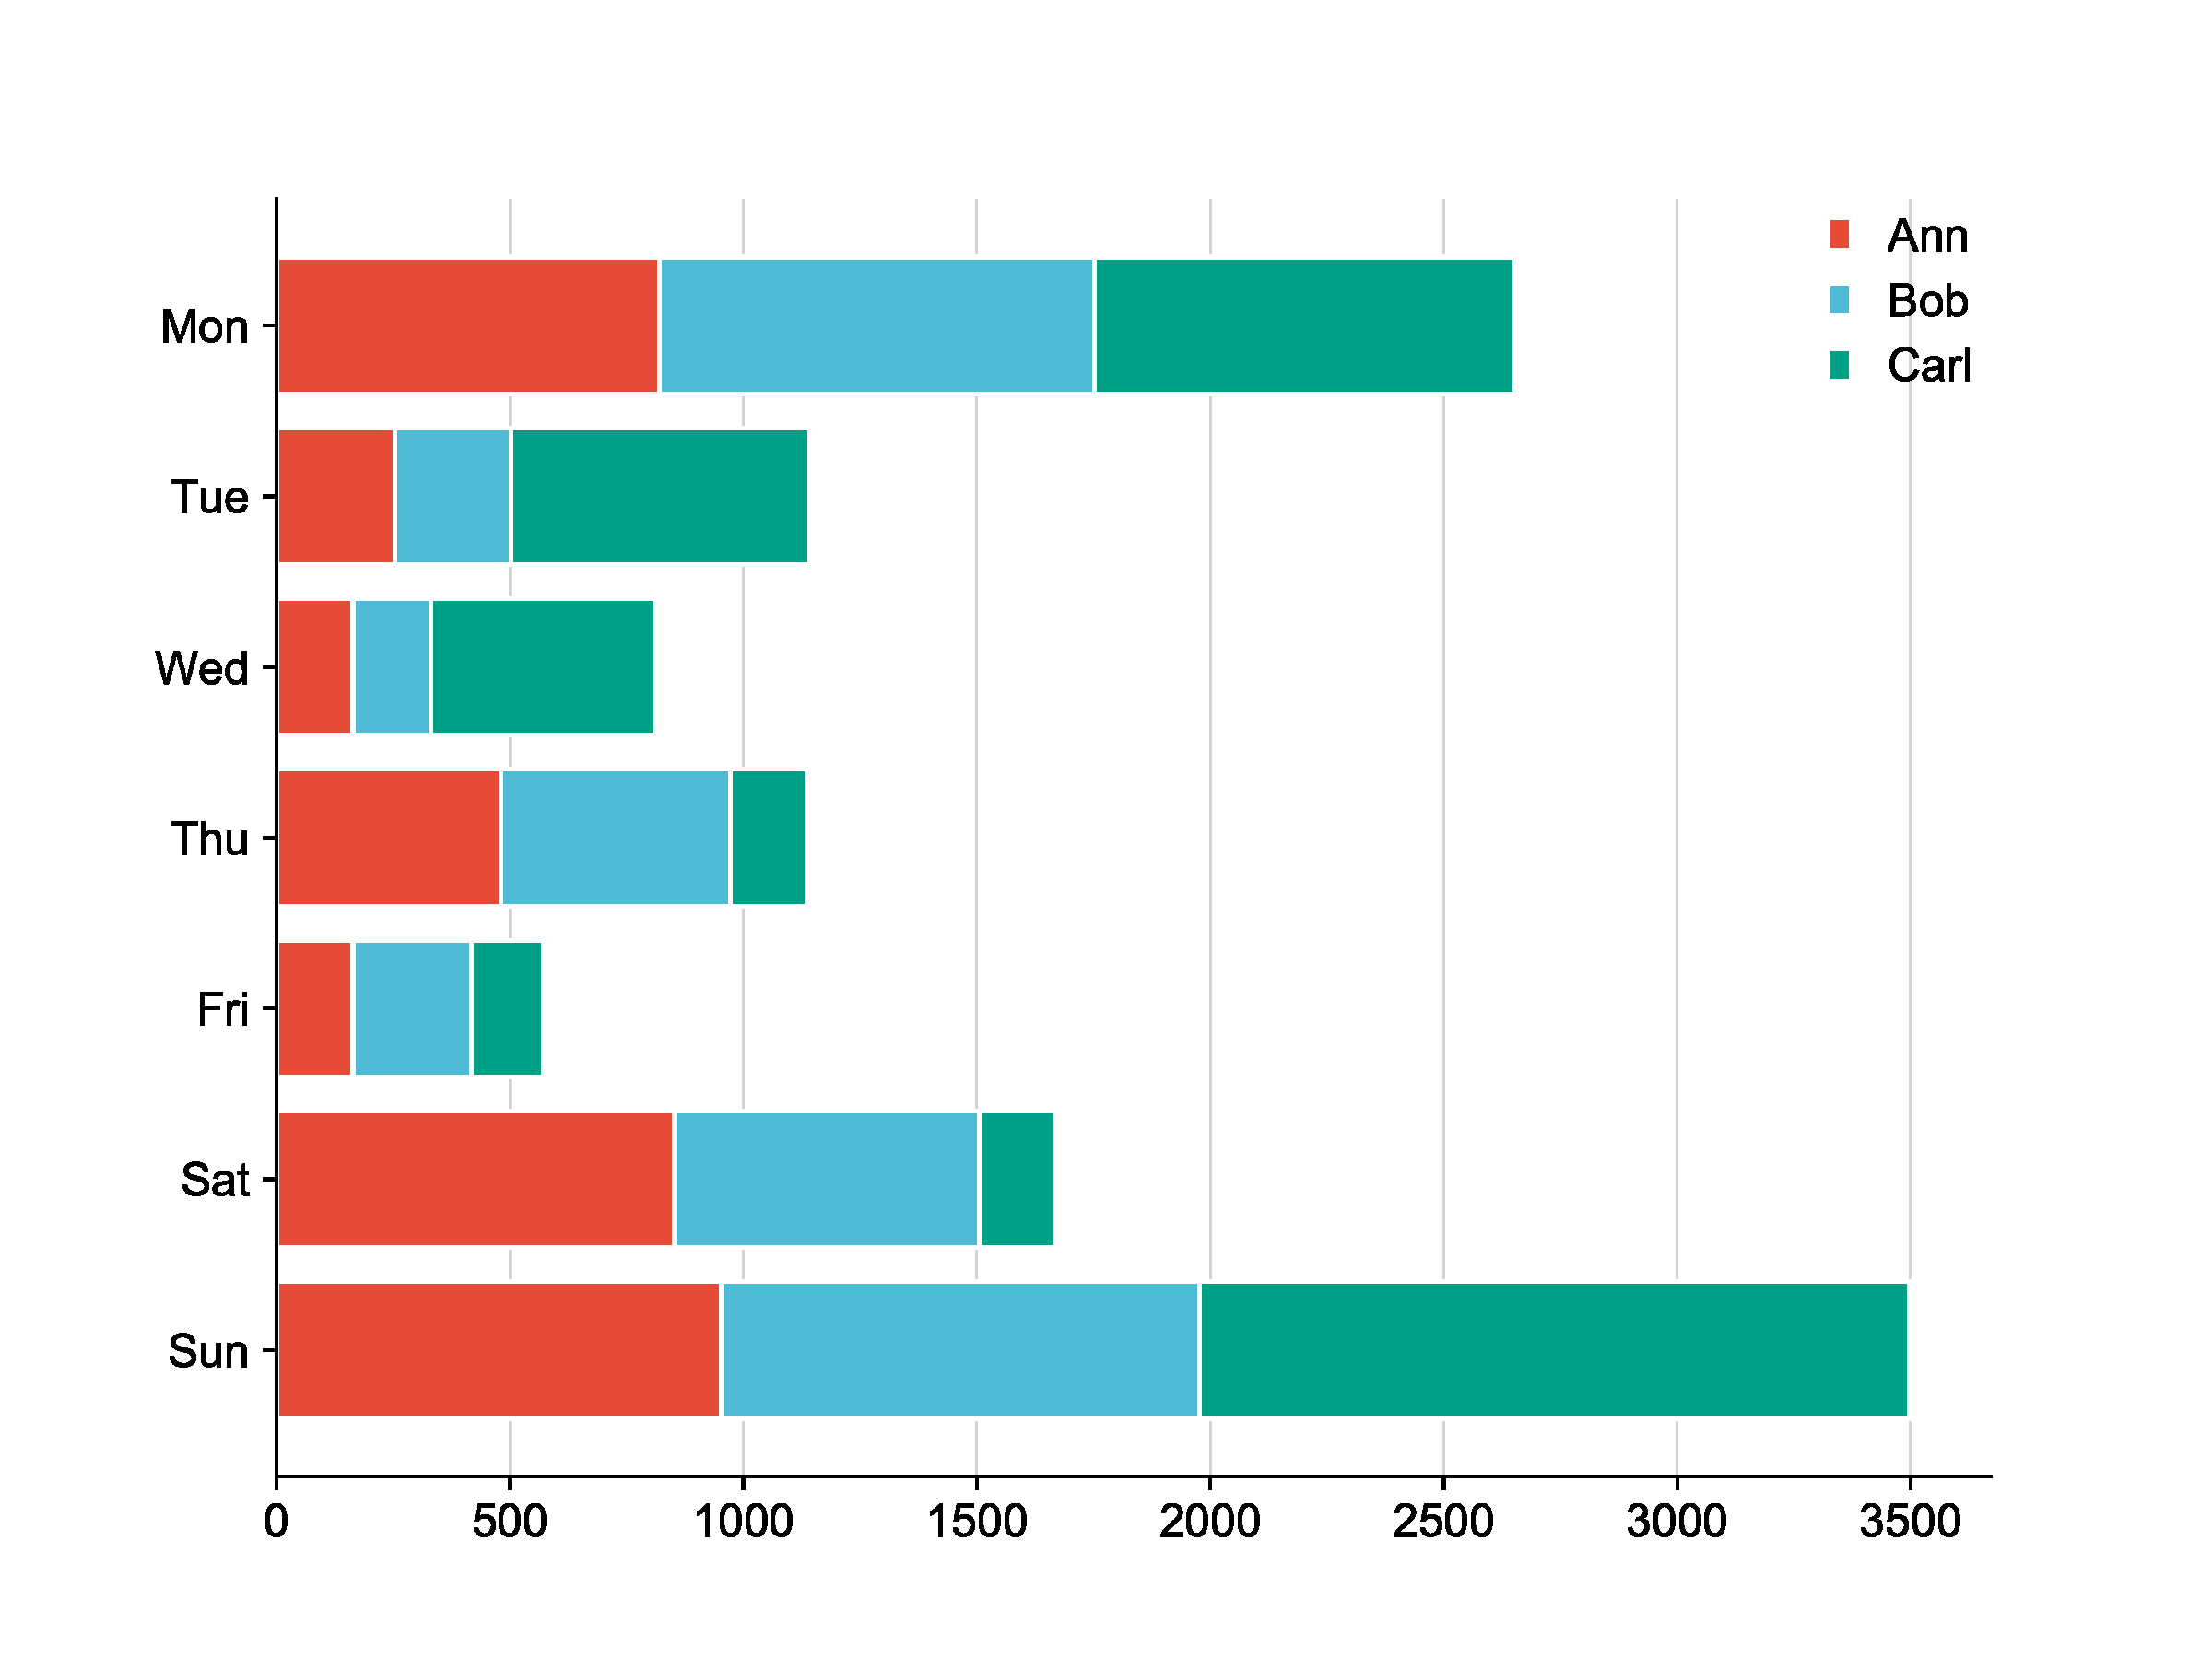
horizontal stack bar plot

Introduction
Input data instructions
Input data contain several rows: the first row is name, and the rest rows are the corresponding values.
Paper example
The Shared Mechanism and Candidate Drugs of Multiple Sclerosis and Sjögren’s Syndrome Analyzed by Bioinformatics Based on GWAS and Transcriptome Data
Input
person	Ann	Bob	Carl
Mon	820	932	901
Tue	254	248	641
Wed	164	167	481
Thu	481	492	164
Fri	164	254	154
Sat	852	654	164
Sun	952	1025	1520
Output

1) How to plot?
1, Put data in excel according to the example format.
2, Copy and paste into input frame.
3, Input pre-checking button to check input
4, After checking pass, select parameters, submit and download

2) How to cite?
4000+ papers in (Google Scholar)
Tang D, Chen M, Huang X, Zhang G, Zeng L, Zhang G, Wu S, Wang Y. SRplot: A free online platform for data visualization and graphing. PLoS One. 2023 Nov 9;18(11):e0294236. doi: 10.1371/journal.pone.0294236. PMID: 37943830.

3) FAQs